Theoretical Paper
- Computer Organization
- Data Structure
- Digital Electronics
- Object Oriented Programming
- Discrete Mathematics
- Graph Theory
- Operating Systems
- Software Engineering
- Computer Graphics
- Database Management System
- Operation Research
- Computer Networking
- Image Processing
- Internet Technologies
- Micro Processor
- E-Commerce & ERP
Practical Paper
Industrial Training

Bresenham's Line Drawing Algorithm page-1
We are required to draw straight lines in a great many computer-generated pictures. Hence it is worthwhile finding out how they are drawn. It is not as simple as it appears to be.
Before we embark upon understanding the line-drawing algorithm let me first remind readers about the co-ordinate system in the real world of limited-precision displays. The top left corner is (0,0) and x increases horizontally, whereas y increases vertically downwards. Also, any addressable point on the display has an integer x and y co-ordinate. With such a co-ordinate system and a display, drawing a vertical, horizontal or a diagonal line at an angle of 45 degrees is fairly simple.
In case of a horizontal line x co-ordinate should be incremented or decremented by 1, whereas the y co-ordinate remains unchanged. Likewise, in case of a vertical line the y co-ordinate should be incremented or decremented by 1, whereas the x co-ordinate remains unchanged. In case of a 45 degree line depending upon the orientation of the line x is incremented or decremented, and so also is y. Note that as the line progresses at every step x as well as the y co-ordinate changes.
However, if the line is inclined at an angle other than 45 degrees then at each step both x and y may not change. For example, if a line is to be drawn from (0, 0) to (100, 50) as we start drawing from (0, 0) x would change more frequently as compared to y since the x distance is the predominant distance. That is, we have to travel more units along x-axis as compared to the y-axis. In such situations x is incremented at every step whereas the algorithm decides whether or not y should be incremented at a given step. Likewise, if for some other line the y distance is the predominant distance then y is incremented at each step whereas x may or may not be.
An interesting algorithm has been developed by Bresenham which changes one of the coordinate value by 1 at each iteration. The other coordinate may or may not change, depending on the value of an error term maintained by the algorithm. This error term records the distance, measured perpendicular to the axis of greatest movement, between the exact path of the line and the actual dots generated. Let us understand this algorithm in detail.
The slope of the line m is given by
m = dely / delx
where,
dely = yb - ya
delx = xb - xa
Naturally, m can be any real number. To simplify our discussion, we will first consider a line for which xa < xb and the slope of the line lies between 0 and 1. In this case, as x increases from xa to xb, the corresponding y increases from ya to yb, but y increases less rapidly than does x because delx > dely. As x increases in unit increments from xa to xb, the best integer y value will sometimes stay the same and sometimes increment by one. Bresenham's algorithm quickly determines which of these should occur. Note that y need never either decrement or increment by more than 1.
The following figure represents a portion of the line under consideration. Each intersection in the grid represents the center of a pixel.
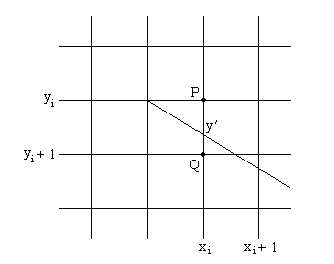
Assume that at xi the best y-value is y'. We wish to know whether the line at xi is closer to the point Pi = ( xi, yi ) or to Qi = (xi, yi + 1 ). At xi the ideal line has y-value given by,
y' = m ( xi - xa ) + ya ------------------ Equation 1
Bresenham used the following measures of the error between the candidate points and the ideal line at xi :
e ( Pi ) = y' - yi
e ( Qi ) = ( yi + 1 ) - y' ------------------ Equation 2
For the ideal line shown in the figure, both of these errors are positive, and e( Pi ) < e( Qi ) if the line passes closer to Pi than to Qi. One possible position of the ideal line is shown in the figure. However, it is quite possible that it passes slightly below Qi or slightly above Pi. If the line passes below Qi, the error e( Qi ) becomes negative, and if it passes above Pi, the error e (Pi ) becomes negative. In all of these cases the difference, e( Pi ) - e( Qi ), can be used to determine which candidate is closer, using the following rule:
Choose Pi if, and only if, e( Pi ) - e( Qi ) < 0.
Thus, we should not increment y if this error term is negative and do increment y if the error is positive.
Let us evaluate e( Pi ) - e( Qi ).
e(Pi) - e(Qi) = y' - yi - ( ( yi + 1 ) - y' )
= y' - yi - yi - 1 + y'
= 2y' - 2yi - 1 -------------------- Equation 3
Substituting the value of y' from Equation 1 into Equation 3 we get,
e(Pi) - e(Qi) = 2 ( m ( xi - xa ) + ya) - 2yi - 1
= 2 ( m ( xi - xa ) + 2 ( ya - yi ) - 1 ------------------- Equation 4
Here, the only non-integer number is m, which is equal to the ratio of two positive integers, dely and delx. Multiply Equation 4 by delx (which won't change the sign of the error, as delx > 0) to form the final error measure ei we get:
ei = delx ( e(Pi) - e(Qi) )
= 2 dely ( xi - xa ) + 2 delx ( ya- yi ) - delx ---------------- Equation 5
Thus the decision rule is, if ei < 0, then choose yi = yi otherwise choose yi = yi + 1
To see how to iterate with this test, Equation 5 can be written in terms of ei + 1 by just replacing i by i+1 everywhere to obtain,
ei + 1 = 2 dely ( xi+1 - xa ) + 2 delx ( ya- yi+1 ) - delx
We can write ei + 1 in terms of ei to get the amount by which the error term must be updated at each step:
ei + 1 - ei = 2 dely ( xi +1 - xa ) + 2 delx ( ya- yi+1 ) - delx
- ( 2 dely ( xi - xa ) + 2 delx ( ya- yi ) - delx )
= 2 dely ( xi +1 - xi ) - 2 delx ( yi - yi+1 - delx )
Recognize that for the line under consideration xi + 1 - xi = 1, hence the above equation becomes,
ei+1 = ei + 2 dely - 2 delx ( yi - yi+1 ) ------------------------- Equation 6
So at each stop on the way from xa to xb we test the sign of ei, choose yi accordingly,
and then compute the next error term, ei + 1. If y is not incremented, then yi = yi + 1,
and from Equation 6 ei+1 = ei + 2dely. If y is incremented then ei+1 = ei + 2 ( dely - delx).
Let us now see how to start the process at i = 0. Now x0 = xa and y0 = ya. Thus, according to Equation 5, with i = 1 we get
e1 = 2 * dely - delx.
The algorithm that we have discussed copes only with the special case xa < xb and 0 < m < 1.
The following figure shows the other cases and the relevant parameters for each case.
| Slope of Line | Predominant distance | Cood. which changes at each step | Coord which may or may not changes |
| 0 < m < 1 | x | x | y |
| m = 1 | x or y | x and y | - |
| 1 < m < ¥ | y | y | x |
| 0 > m > -1 | x | x | y |
| m = -1 | x or y | x and y | - |
| -1 > m > ¥ | y | y | x |
Given below is the code for implementing Bresnham's algorithm for all cases mentioned in the above figure.
#include "graphics.h"
#define INCR 1
#define DECR -1
#define PREDX 1
#define PREDY 0
int dx, dy, e, e_inc, e_noinc ;
main( )
{
int gd = DETECT, gm ;
initgraph ( &gd, &gm, "c:\\tc\\bgi" ) ;
bressline ( 0, 300, 300, 300 ) ; /* m = 0, horizontal line */
bressline ( 100, 200, 100, 300 ) ; /* m = infinity, vertical line */
bressline ( 0, 0, 100, 50 ) ; /* 0 < m < 1 */
bressline ( 100, 50, 0, 0 ) ; /* 0 < m < 1 */
bressline ( 0, 0, 100, 100 ) ; /* m = 1 */
bressline ( 100, 100, 0, 0 ) ; /* m = 1 */
bressline ( 0, 0, 100, 150 ) ; /* 1 < m < infinity */
bressline ( 100, 150, 0, 0 ) ; /* 1 < m < infinity */
bressline ( 0, 150, 100, 100 ) ; /* 0 > m > -1 */
bressline ( 100, 100, 0, 150 ) ; /* 0 > m > -1 */
bressline ( 0, 200, 100, 100 ) ; /* m = -1 */
bressline ( 100, 100, 0, 200 ) ; /* m = -1 */
bressline ( 100, 100, 0, 300 ) ; /* -1 > m > 0 */
bressline ( 0, 300, 100, 100 ) ; /* -1 > m > 0 */
getch( ) ;
closegraph( ) ;
}