Theoretical Paper
- Computer Organization
- Data Structure
- Digital Electronics
- Object Oriented Programming
- Discrete Mathematics
- Graph Theory
- Operating Systems
- Software Engineering
- Computer Graphics
- Database Management System
- Operation Research
- Computer Networking
- Image Processing
- Internet Technologies
- Micro Processor
- E-Commerce & ERP
Practical Paper
Industrial Training

ML - Understanding Data with Visualization
Introduction
In the previous chapter, we have discussed the importance of data for Machine Learning algorithms along with some Python recipes to understand the data with statistics. There is another way called Visualization, to understand the data.
With the help of data visualization, we can see how the data looks like and what kind of correlation is held by the attributes of data. It is the fastest way to see if the features correspond to the output. With the help of following Python recipes, we can understand ML data with statistics.
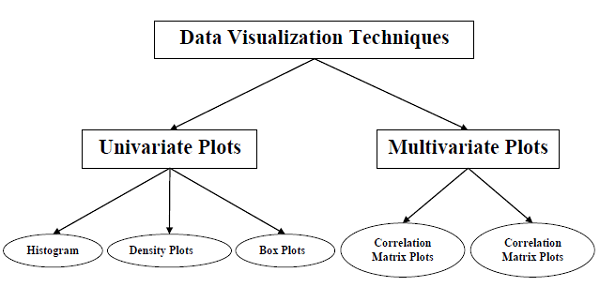
Univariate Plots: Understanding Attributes Independently
The simplest type of visualization is single-variable or “univariate” visualization. With the help of univariate visualization, we can understand each attribute of our dataset independently. The following are some techniques in Python to implement univariate visualization −
Sr.No. |
Univariate Plots & Description |
1 |
Histograms Histograms group the data in bins and is the fastest way to get idea about the distribution of each attribute in dataset. |
2 |
Density Plots Another quick and easy technique for getting each attributes distribution is Density plots. |
3 |
Box and Whisker Plots Box and Whisker plots, also called boxplots in short, is another useful technique to review the distribution of each attribute’s distribution. |
Multivariate Plots: Interaction Among Multiple Variables
Another type of visualization is multi-variable or “multivariate” visualization. With the help of multivariate visualization, we can understand interaction between multiple attributes of our dataset. The following are some techniques in Python to implement multivariate visualization −
Sr.No. |
Multivariate Plots & Description |
1 |
Correlation Matrix Plot Correlation is an indication about the changes between two variables. |
2 |
Scatter Matrix Plot Scatter plots shows how much one variable is affected by another or the relationship between them with the help of dots in two dimensions. |