Theoretical Paper
- Computer Organization
- Data Structure
- Digital Electronics
- Object Oriented Programming
- Discrete Mathematics
- Graph Theory
- Operating Systems
- Software Engineering
- Computer Graphics
- Database Management System
- Operation Research
- Computer Networking
- Image Processing
- Internet Technologies
- Micro Processor
- E-Commerce & ERP
Practical Paper
Industrial Training

Machine Learning - What is Machine Learning?
Consider the following figure that shows a plot of house prices versus its size in sq. ft.
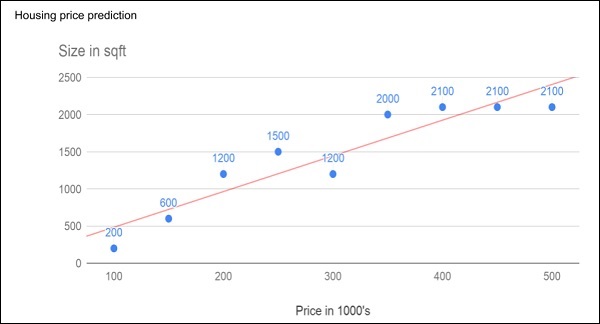
After plotting various data points on the XY plot, we draw a best-fit line to do our predictions for any other house given its size. You will feed the known data to the machine and ask it to find the best fit line. Once the best fit line is found by the machine, you will test its suitability by feeding in a known house size, i.e. the Y-value in the above curve. The machine will now return the estimated X-value, i.e. the expected price of the house. The diagram can be extrapolated to find out the price of a house which is 3000 sq. ft. or even larger. This is called regression in statistics. Particularly, this kind of regression is called linear regression as the relationship between X & Y data points is linear.
In many cases, the relationship between the X & Y data points may not be a straight line, and it may be a curve with a complex equation. Your task would be now to find out the best fitting curve which can be extrapolated to predict the future values. One such application plot is shown in the figure below.
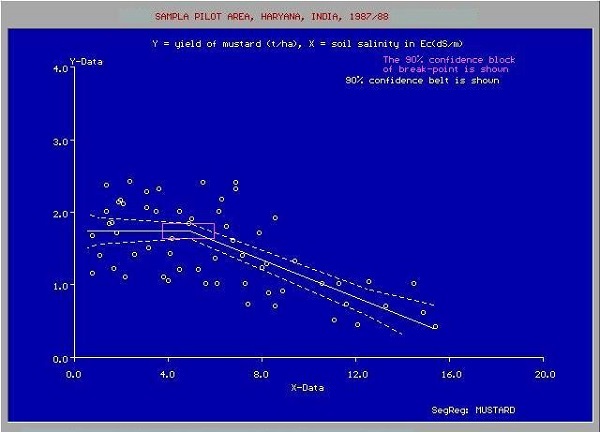
You will use the statistical optimization techniques to find out the equation for the best fit curve here. And this is what exactly Machine Learning is about. You use known optimization techniques to find the best solution to your problem.
Next, let us look at the different categories of Machine Learning.