Theoretical Paper
- Computer Organization
- Data Structure
- Digital Electronics
- Object Oriented Programming
- Discrete Mathematics
- Graph Theory
- Operating Systems
- Software Engineering
- Computer Graphics
- Database Management System
- Operation Research
- Computer Networking
- Image Processing
- Internet Technologies
- Micro Processor
- E-Commerce & ERP
Practical Paper
Industrial Training
Standard Deviations and Variance
The variance and the closely-related standard deviation are measures of how spread out a distribution is. In other words, they are measures of variability.
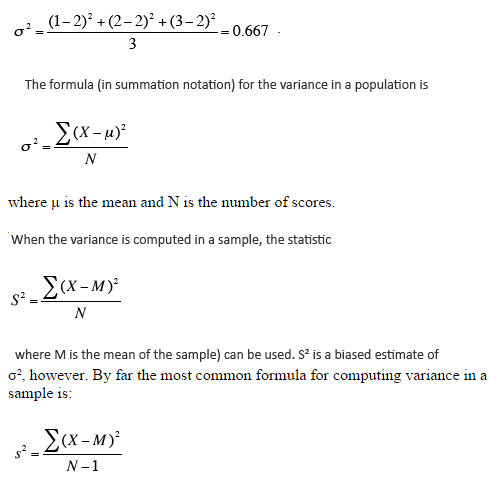
The variance is computed as the average squared deviation of each number from its mean. For example, for the numbers 1, 2, and 3, the mean is 2 and the variance is:
.
The formula (in summation notation) for the variance in a population is
where μ is the mean and N is the number of scores.
When the variance is computed in a sample, the statistic
(where M is the mean of the sample) can be used. S² is a biased estimate of σ², however. By far the most common formula for computing variance in a sample is:
which gives an unbiased estimate of σ². Since samples are usually used to estimate parameters, s² is the most commonly used measure of variance. Calculating the variance is an important part of many statistical applications and analyses. It is the first step in calculating the standard deviation.
Standard Deviation
The standard deviation formula is very simple: it is the square root of the variance. It is the most commonly used measure of spread.
An important attribute of the standard deviation as a measure of spread is that if the mean and standard deviation of a normal distribution are known, it is possible to compute the percentile rank associated with any given score. In a normal distribution, about 68% of the scores are within one standard deviation of the mean and about 95% of the scores are within two standard deviations of the mean.
The standard deviation has proven to be an extremely useful measure of spread in part because it is mathematically tractable. Many formulas in inferential statistics use the standard deviation.

