Theoretical Paper
- Computer Organization
- Data Structure
- Digital Electronics
- Object Oriented Programming
- Discrete Mathematics
- Graph Theory
- Operating Systems
- Software Engineering
- Computer Graphics
- Database Management System
- Operation Research
- Computer Networking
- Image Processing
- Internet Technologies
- Micro Processor
- E-Commerce & ERP
- Dart Programming
- Flutter Tutorial
- Numerical Methods Tutorials
- Flutter Tutorials
Practical Paper
Industrial Training

Flutter Charts
A chart is a graphical representation of data where data is represented by a symbol such as a line, bar, pie, etc. In Flutter, the chart behaves the same as a normal chart. We use a chart in Flutter to represent the data in a graphical way that allows the user to understand them in a simple manner. We can also plot a graph to represents the rise and fall of our values. The chart can easily read the data and helps us to know the performance on a monthly or yearly basis whenever we need it.
Supported Chart Types in Flutter
Flutter supports mainly three types of charts, and each chart comes with several configuration options. The following are the chart used in Flutter application:
- Line Chart
- Bar Chart
- Pie and Donut Chart
Line Chart
A line chart is a graph that uses lines for connecting individual data points. It displays the information in a series of data points. It is mainly used to track changes over a short and long period of time.
We can use it as below:
LineChart(
  LineChartData(
    // write your logic
  ),
);
Bar Chart
It is a graph that represents the categorical data with rectangular bars. It can be horizontal or vertical.
We can use it as below:
BarChart(
  BarChartData(
    // write your logic
  ),
);
Pie or Donut Chart
It is a graph that displays the information in a circular graph. In this graph, the circle is divided into sectors, and each shows the percentage or proportional data.
We can use it as below:
PieChart(
  PieChartData(
    // write your logic
  ),
);
Let us understand it with the help of an example.
Example
Open the IDE and create the new Flutter project. Next, open the project, navigate to the lib folder, and open the pubspec.yaml file. In this file, we need to add the chart dependency. Flutter provides several chart dependency, and here we are going to use fl_chart dependency. So add it as below:
dependencies:
  flutter:
    sdk: flutter
  fl_chart: ^0.10.1
After adding the dependency, click on the get packages link shown on the screen's top left corner. Now, open the main.dart file and replace it with the below code:
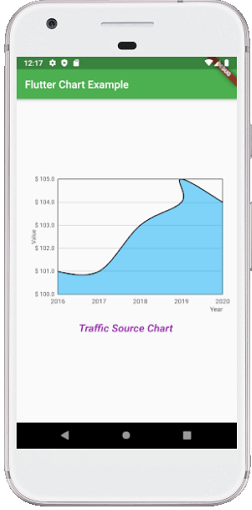
import 'package:flutter/material.dart';
import 'package:fl_chart/fl_chart.dart';

void main() => runApp(MyApp());

/// This Widget is the main application widget.
class MyApp extends StatelessWidget {
  @override
  Widget build(BuildContext context) {
    return MaterialApp(
      home: HomePage(),
    );
  }
}

class HomePage extends StatelessWidget {
  @override
  Widget build(BuildContext context) {
    return Scaffold(
      appBar: AppBar(
        title: const Text('Flutter Chart Example'),
          backgroundColor: Colors.green
      ),
      body: Center(
        child: Column(
          mainAxisAlignment: MainAxisAlignment.center,
          children: < Widget>[
            LineCharts(),
            Padding(
              padding: const EdgeInsets.all(16.0),
              child: Text(
                "Traffic Source Chart",
                  style: TextStyle(
                      fontSize: 20,
                      color: Colors.purple,
                      fontWeight: FontWeight.w700,
                      fontStyle: FontStyle.italic
                  )
              )
            ),
          ],
        ),
      ),
    );
  }
}

class LineCharts extends StatelessWidget {
  @override
  Widget build(BuildContext context) {
    const cutOffYValue = 0.0;
    const yearTextStyle =
    TextStyle(fontSize: 12, color: Colors.black);

    return SizedBox(
      width: 360,
      height: 250,
      child: LineChart(
        LineChartData(
          lineTouchData: LineTouchData(enabled: false),
          lineBarsData: [
            LineChartBarData(
              spots: [
                FlSpot(0, 1),
                FlSpot(1, 1),
                FlSpot(2, 3),
                FlSpot(3, 4),
                FlSpot(3, 5),
                FlSpot(4, 4)
              ],
              isCurved: true,
              barWidth: 2,
              colors: [
                Colors.black,
              ],
              belowBarData: BarAreaData(
                show: true,
                colors: [Colors.lightBlue.withOpacity(0.5)],
                cutOffY: cutOffYValue,
                applyCutOffY: true,
              ),
              aboveBarData: BarAreaData(
                show: true,
                colors: [Colors.lightGreen.withOpacity(0.5)],
                cutOffY: cutOffYValue,
                applyCutOffY: true,
              ),
              dotData: FlDotData(
                show: false,
              ),
            ),
          ],
          minY: 0,
          titlesData: FlTitlesData(
            bottomTitles: SideTitles(
                showTitles: true,
                reservedSize: 5,
                textStyle: yearTextStyle,
                getTitles: (value) {
                  switch (value.toInt()) {
                    case 0:
                      return '2016';
                    case 1:
                      return '2017';
                    case 2:
                      return '2018';
                    case 3:
                      return '2019';
                    case 4:
                      return '2020';
                    default:
                      return '';
                  }
                }),
            leftTitles: SideTitles(
              showTitles: true,
              getTitles: (value) {
                return '\$ ${value + 100}';
              },
            ),
          ),
          axisTitleData: FlAxisTitleData(
              leftTitle: AxisTitle(showTitle: true, titleText: 'Value', margin: 10),
              bottomTitle: AxisTitle(
                  showTitle: true,
                  margin: 10,
                  titleText: 'Year',
                  textStyle: yearTextStyle,
                  textAlign: TextAlign.right)),
          gridData: FlGridData(
            show: true,
            checkToShowHorizontalLine: (double value) {
              return value == 1 || value == 2 || value == 3 || value == 4;
            },
          ),
        ),
      ),
    );
  }
}
Output:
When we run the app in the device or emulator, we will get the UI of the screen similar to the below screenshot: