Theoretical Paper
- Computer Organization
- Data Structure
- Digital Electronics
- Object Oriented Programming
- Discrete Mathematics
- Graph Theory
- Operating Systems
- Software Engineering
- Computer Graphics
- Database Management System
- Operation Research
- Computer Networking
- Image Processing
- Internet Technologies
- Micro Processor
- E-Commerce & ERP
- Dart Programming
Practical Paper
Industrial Training
Dart Programming - Debugging
Every now and then, developers commit mistakes while coding. A mistake in a program is referred to as a bug. The process of finding and fixing bugs is called debugging and is a normal part of the development process. This section covers tools and techniques that can help you with debugging tasks.
The WebStorm editor enables breakpoints and step-by-step debugging. The program will break at the point where the breakpoint is attached. This functionality is like what you might expect from Java or C# application development. You can watch variables, browse the stack, step over and step into method and function calls, all from the WebStorm Editor.
Adding a Breakpoint
Consider the following code snippet. (TestString.dart)
void main() {
   int a = 10, b = 20, c = 5;
   c = c * c * c;

   print("$a + $b = ${a+b}");
   print("$a%$b = ${a%b}");  // Add a break point here
   print("$a*$b = ${a*b}");
   print("$a/$b = ${a/b}");
   print(c);
}
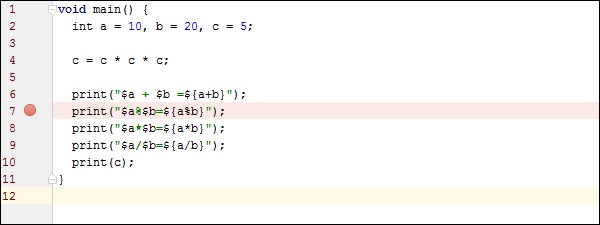
To add a breakpoint , click on the left margin to. In the figure given below, line number 7 has a break point.

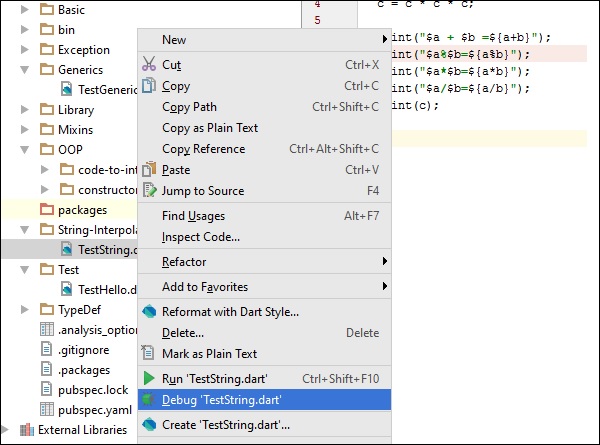
Run the program in debug mode . In the project explorer right click on the dart program in our case TestString.dart.

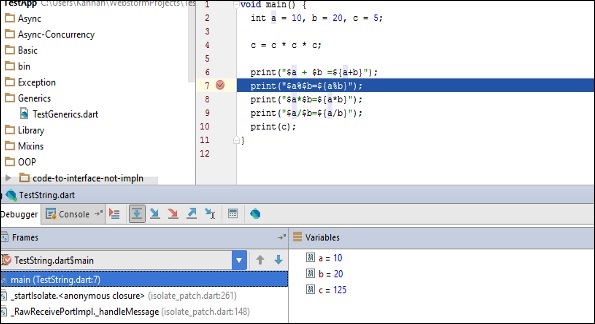
Once the program runs in debug mode, you will get the Debugger window as shown in the following screenshot. The variables tab shows the values of variables in the current context. You can add watchers for specific variables and listen to that values changes using watches window.

Step Into (F7) arrow icon on debug menu helps to Executes code one statement at a time. If main methods call a subroutine, then this will go into the subroutine code also.
Step over (F8): It is similar to Step Into. The difference in use occurs when the current statement contains a call to a subroutine. If the main method calls a subroutine, step over will not drill into the subroutine. it will skip the subroutine.
Step Out (Shift+F8): Executes the remaining lines of a function in which the current execution point lies. The next statement displayed is the statement following the subroutine call.
After running in debug mode, the program gives the following output −
10 + 20 = 30
10 % 20 = 10
10 * 20 = 200
10 / 20 = 0.5
125

