Theoretical Paper
- Computer Organization
- Data Structure
- Digital Electronics
- Object Oriented Programming
- Discrete Mathematics
- Graph Theory
- Operating Systems
- Software Engineering
- Computer Graphics
- Database Management System
- Operation Research
- Computer Networking
- Image Processing
- Internet Technologies
- Micro Processor
- E-Commerce & ERP
Practical Paper
Industrial Training
Bresenham's Circle Drawing Algorithm
We now know how to draw lines at any angle. Circles too are frequently needed in applications, and we need a way to generate their corresponding pixel patterns from the information such as coordinates of the center and the radius. Let us first see the theory behind the Bresenham’s circle generating algorithm.
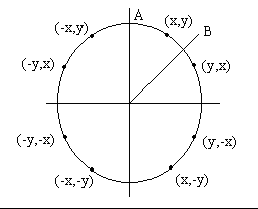
Suppose we want to draw a circle with center ( 0, 0 ) and radius R, where R is an integer. We want the set of pixels that should be lit up to provide the best approximation to the ideal circle. The equation of a circle is X2 + Y2 = R2. But we can reduce the amount of computation required by capitalising on the symmetry of a circle, as we need only compute the ( x, y ) values in one octant of the circle. For a given point ( x, y ) on the circle there are seven other points along the circle whose coordinates can be easily found. Simply negating and/or interchanging x and y produces the seven locations, ( -x, y ), ( -x, -y ), ( x, -y ), ( y, x ), ( -y, x ), ( -y, -x ) and ( y, -x ). This is shown in Figure 1

Figure 1.
Assuming that the coordinates of the pixel to be illuminated in the octant A to B are P ( x, y ), P should lie at distance R from the origin, so a measure of the error exhibited by P can be the difference between the square of its true distance and R2:
e ( P ) = ( x2 + y2 ) - R2
Error e( P ) will be positive if P is too far from the origin, and negative otherwise.
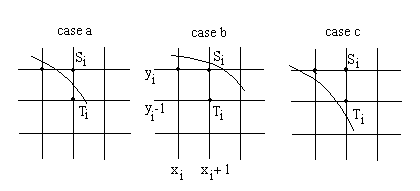
Suppose we have determined that the best point at step i is Pi = ( xi, yi ) = ( xi, yi ). Now we can increment xi by 1 and ask which of the points, Si = ( xi + 1, yi ) or Ti = ( xi + 1, yi - 1), is closer to the circle. We can form the errors e( Si ) and e( Ti ) for these candidates, but we want to find a way to combine them into a single error quantity, say di, whose sign then can be used to make the choice between the two points. The three cases that can occur are shown in Figure 2. Let us tackle the three cases:

Figure 2
-
The (true) circle C lies between Si and Ti: If C lies between the two points, the two errors will have opposite signs: e( Si ) > 0, whereas e( Ti ) < 0. We can use the sign of their sum as the error quantity: di = e ( Si ) + e( Ti ). If C is nearer Ti the sum di the will be positive. On the other hand, if Si is closer to C, the sum will be negative. So the test: "choose Si if di < 0; otherwise choose Ti" works for this case.
-
If the true circle lies above (or on ) Si: We should choose Si, as both errors are negative, and so their sum di is negative. Thus the same test would work.
-
If the true circle lies below (or on) Ti: Here Ti must be chosen, since di is positive because both errors are positive.
Thus we can now frame the rule for all three cases: "Choose Si if di < 0; otherwise choose Ti".
Now what remains to be done is finding an efficient way to update di. We have found that the error term di is equal to:
di = e ( Si ) + e ( Ti )
= ( xi + 1 )2 + yi 2 - R2 + ( xi + 1 )2 + ( yi - 1 )2 - R2
= 2 ( xi + 1 )2 + yi2 + ( yi - 1 )2 - 2R2
Likewise,
di+1 = 2 ( xi+1 + 1 )2 + yi+12 + ( yi+1 - 1 )2 - 2R2
Writing di+1 in terms of di we get:
di+1 = di + 4xi + 6 + 2 ( yi+12 - yi2 ) - 2 ( yi+1 - yi )
if di+1 < 0 then y does not change and di+1 is:
di+1 = di + 4xi + 6
Otherwise yi+1 = yi-1 and di+1 is:
di+1 = di + 4 ( xi - yi ) + 10
To start the algorithm, x0 = 0 and y0 = R, hence Si = ( 1, R ) and Ti = ( 1, R - 1 ).
Thus, di = 3 - 2 * R.
If we are to draw the circle of radius R placed at center point (xc,yc), the circle is shifted to this center simply by offsetting the x and y values as shown in the following program:
# include "graphics.h"
main( )
{
int i, j, x1, y1, r, p, a ;
int gd = DETECT, gm, x, y ;
printf ( "Enter coordinates of center and radius of circle" ) ;
scanf ( "%d %d %d", &x, &y, &r ) ;
initgraph ( &gd, &gm, "c:\\tc\\bgi" ) ;
x1 = 0 ;
y1 = r ;
p = 3 - 2 * r ;
while ( x1 < y1 )
{
plotcircle ( x, y, x1, y1 ) ;
if ( p < 0 )
p = p + 4 * x1 + 6 ;
else
{
p = p + 4 * ( x1 - y1 ) + 10 ;
y1 = y1 - 1 ;
}
x1 = x1 + 1 ;
}
if ( x1 == y1 )
plotcircle ( x, y, x1, y1 ) ;
getch( ) ;
closegraph( ) ;
restorecrtmode( ) ;
}
plotcircle ( int x, int y, int x1, int y1 )
{
putpixel ( x + x1, y + y1, 15 ) ;
putpixel ( x - x1, y + y1, 15 ) ;
putpixel ( x + x1, y - y1, 15 ) ;
putpixel ( x - x1, y - y1, 15 ) ;
putpixel ( x + y1, y + x1, 15 ) ;
putpixel ( x - y1, y + x1, 15 ) ;
putpixel ( x + y1, y - x1, 15 ) ;
putpixel ( x - y1, y - x1, 15 ) ;
}

