Theoretical Paper
- Computer Organization
- Data Structure
- Digital Electronics
- Object Oriented Programming
- Discrete Mathematics
- Graph Theory
- Operating Systems
- Software Engineering
- Computer Graphics
- Database Management System
- Operation Research
- Computer Networking
- Image Processing
- Internet Technologies
- Micro Processor
- E-Commerce & ERP
Practical Paper
Industrial Training

Structure Charts
Once the flow of data and control in the system is decided using tools like DFDs and CFDs, the system is given shape through programming. Prior to this, the basic infrastructure of the program layout is prepared based on the concepts of modular programming.
In modular programming, the complete system is coded as small independent interacting modules. Each module is aimed at doing one specific task. The design for these modules is prepared in the form of structure charts.
A structure chart is a design tool that pictorially shows the relation between processing modules in computer software. Describes the hierarchy of components modules and the data are transmitted between them. Includes analysis of input-to-output transformations and analysis of transaction.
Structure charts show the relation of processing modules in computer software. It is a design tool that visually displays the relationships between program modules. It shows which module within a system interacts and graphically depicts the data that are communicated between various modules.
Structure charts are developed prior to the writing of program code. They identify the data passes existing between individual modules that interact with one another.
They are not intended to express procedural logic. This task is left to flowcharts and pseudocode. They don't describe the actual physical interface between processing functions.
Notation
Program modules are identified by rectangles with the module name written inside the rectangle.
Arrows indicate calls, which are any mechanism used to invoke a particular module.
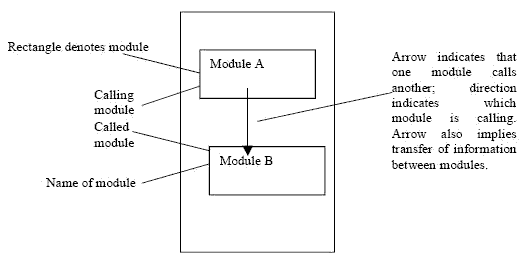
Annotations on the structure chart indicate the parameter that are passed and the direction of the data movement. In fig. 6.3, we see that modules A and B interact. Data identified as X and Y are passed to module B, which in turn passes back Z.
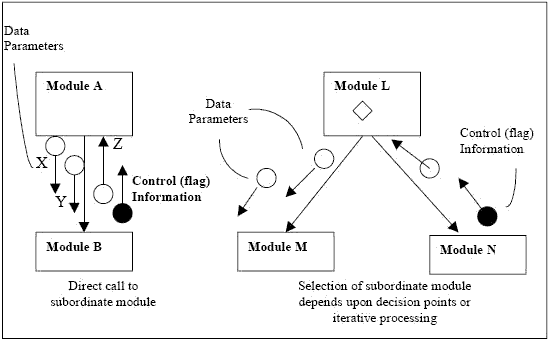
A calling module can interact with more than one subordinate module. Fig. 6.3 also shows module L calling subordinate modules M and N. M is called on the basis of a decision point in L (indicated by the diamond notation), while N is called on the basis of the iterative processing loop (noted by the arc at the start of the calling arrow.
Data passing
When one module calls another, the calling module can send data to the called module so that it can perform the function described in its name. The called module can produce data that are passed back to the calling module.
Two types of data are transmitted. The first, parameter data, are items of data needed in the called module to perform the necessary work. A small arrow with an open circle at the end is used to note the passing of data parameters. In addition, control information (flag data) is also passed. Its purpose is to assist in the control of processing by indicating the occurrence of, say, errors or end-of-conditions. A small arrow with a closed circle indicates the control information. A brief annotation describes the type of information passed.
Structure chart is a tool to assist the analyst in developing software that meets the objectives of good software design.